Here are the 9 best PageSpeed tools in 2026, tested and compared using real data.
We checked which ones actually help you rank better and convert more.
Updated 27th April 2026
- PageSpeed Insights
- lighthouse
- GTmetrix
- Pingdom
- WebPageTest
- KeyCDN Performance Test
- SpeedVitals
- Uptrends
- DebugBear
We put PageSpeed Insights, GTmetrix, Lighthouse, WebPageTest and a few others through identical,
Real-world scenarios to see which tool is most accurate, most actionable, and most useful for WordPress in 2026.
For SEO and Core Web Vitals, PageSpeed Insights remains the most reliable tool.
Accompanying each tool link, we give a breakdown of what each tool will measure.
After reading, you can use the link below to see our proof.
PageSpeed Proof Archive
The design of this page is to help you work out which PageSpeed tool is best to use now in 2026.
We tested them side by side to find out.
Website speed testing has become one of the most important parts of modern SEO.
For a full breakdown of how to run and interpret results, see our PageSpeed Insights guide.
Best PageSpeed Tools Listed Below
If you’re looking for the best PageSpeed tools in the UK, below is what actually works in 2026.
A slow website frustrates visitors, increases bounce rates, and can reduce visibility in search results.
The difficulty is that many different speed testing tools exist.
Each one measures performance in a slightly different way.
Some tools focus on Core Web Vitals, while others focus on loading behaviour, diagnostics, or monitoring.
So which PageSpeed tool is actually best for analysing website speed?
The truth is that no single tool tells the entire story.
The best approach is to understand what each tool measures and when you should use it.
This guide explains the most common website speed testing tools and how they help analyse performance.
Run a Google PageSpeed Test for Your Website (Free Tool Below)
⚠️MOST WEBSITES SCORE UNDER 50
HOW ABOUT YOURS?
✅ Independently verified by Google PageSpeed
Try a FREE website speed check below
🔗 TEST YOUR SITE SPEED NOW
**PSI is a testing tool, not an endorsement.**
A genuine endorsement of our performance work
You can read the official WPX appraisal below.
WPX APPRAISAL
One Job P/Day =FULL FOCUS
We only take on one website per day, because rushing speed work doesn’t cut it.
Your site gets our full focus, and every detail is tuned for performance.
This hands-on approach consistently changes your PSI scores to green. It boosts Google rankings.
You will attract more traffic, more visibility, and ultimately, more business.
However, the good news is that once you know how to use Google PageSpeed Insights properly,
You’ll uncover exactly what’s dragging your site down and how to fix it for good.
What Makes a Good Website Speed Testing Tool?
A reliable speed testing tool should help identify what slows a page down.
Basically, how quickly users can interact with it.
A good tool should measure:
• loading speed
• render blocking resources
• layout stability during loading
• interaction delays caused by scripts
Best PageSpeed Tools Compared
Independent comparison of the most widely used website speed testing tools.
Some tools specialise in Core Web Vitals, while others provide deeper technical diagnostics.
Diagnostics such as network waterfalls.
Using several tools together often provides the most accurate picture of website performance.
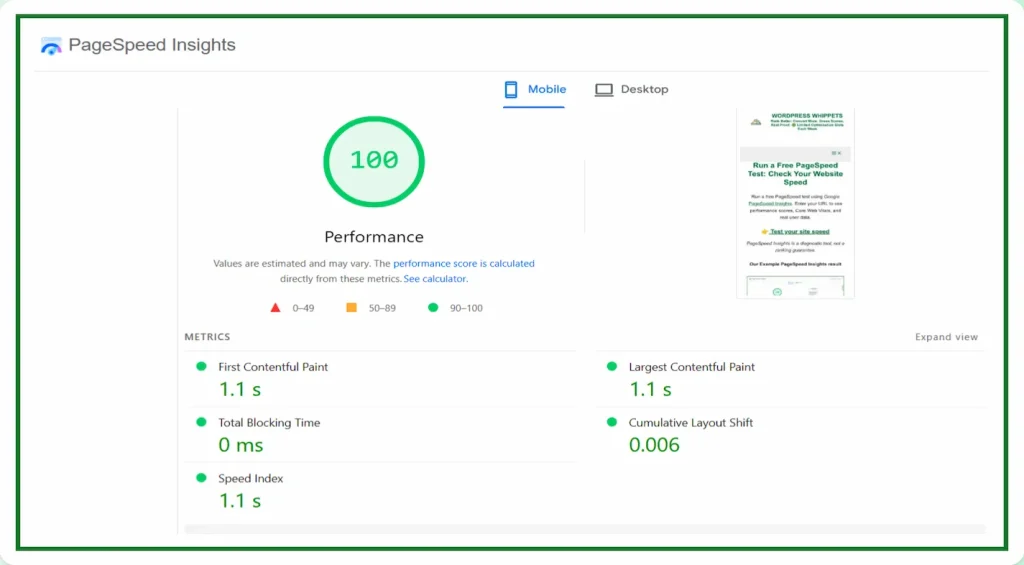
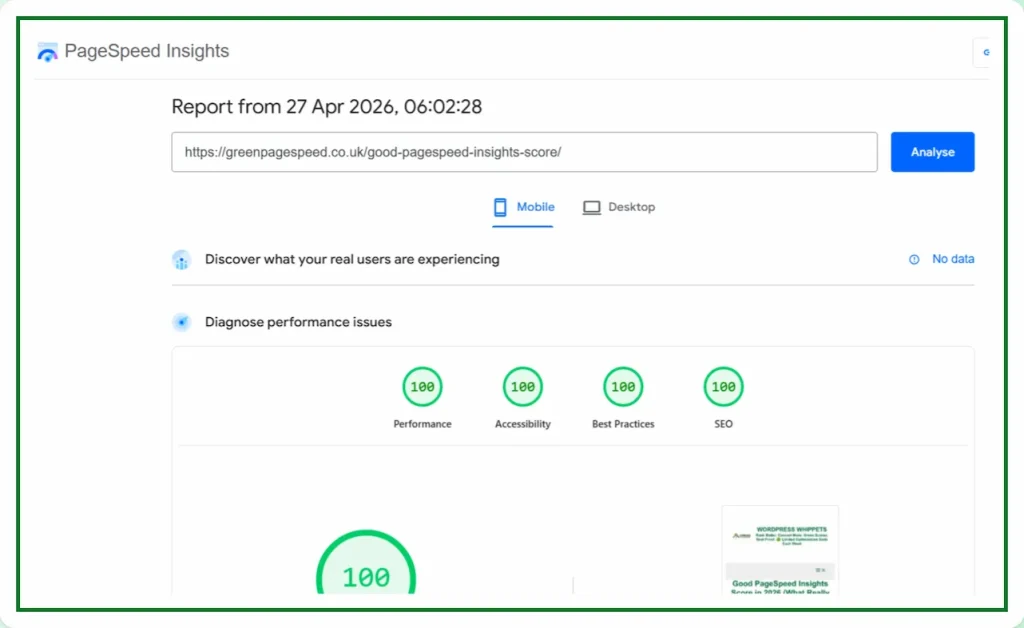
PageSpeed Insights
This tool is the most widely referenced website speed testing tool.
This is because it reports Google’s own performance metrics.
It measures Core Web Vitals, including:
• Largest Contentful Paint
• Interaction to Next Paint
• Cumulative Layout Shift
PageSpeed Insights combines lab testing data with real user data collected from Chrome users.
Because of this, the results closely reflect how Google evaluates website performance in search results.
For many SEO specialists, PageSpeed Insights acts as the primary performance benchmark.
Lighthouse
This tool is an auditing tool developed by Google and built directly into Chrome DevTools.
It evaluates several aspects of a website, including performance, accessibility, best practices, and SEO.
Developers frequently use Lighthouse during optimisation because it provides detailed technical diagnostics.
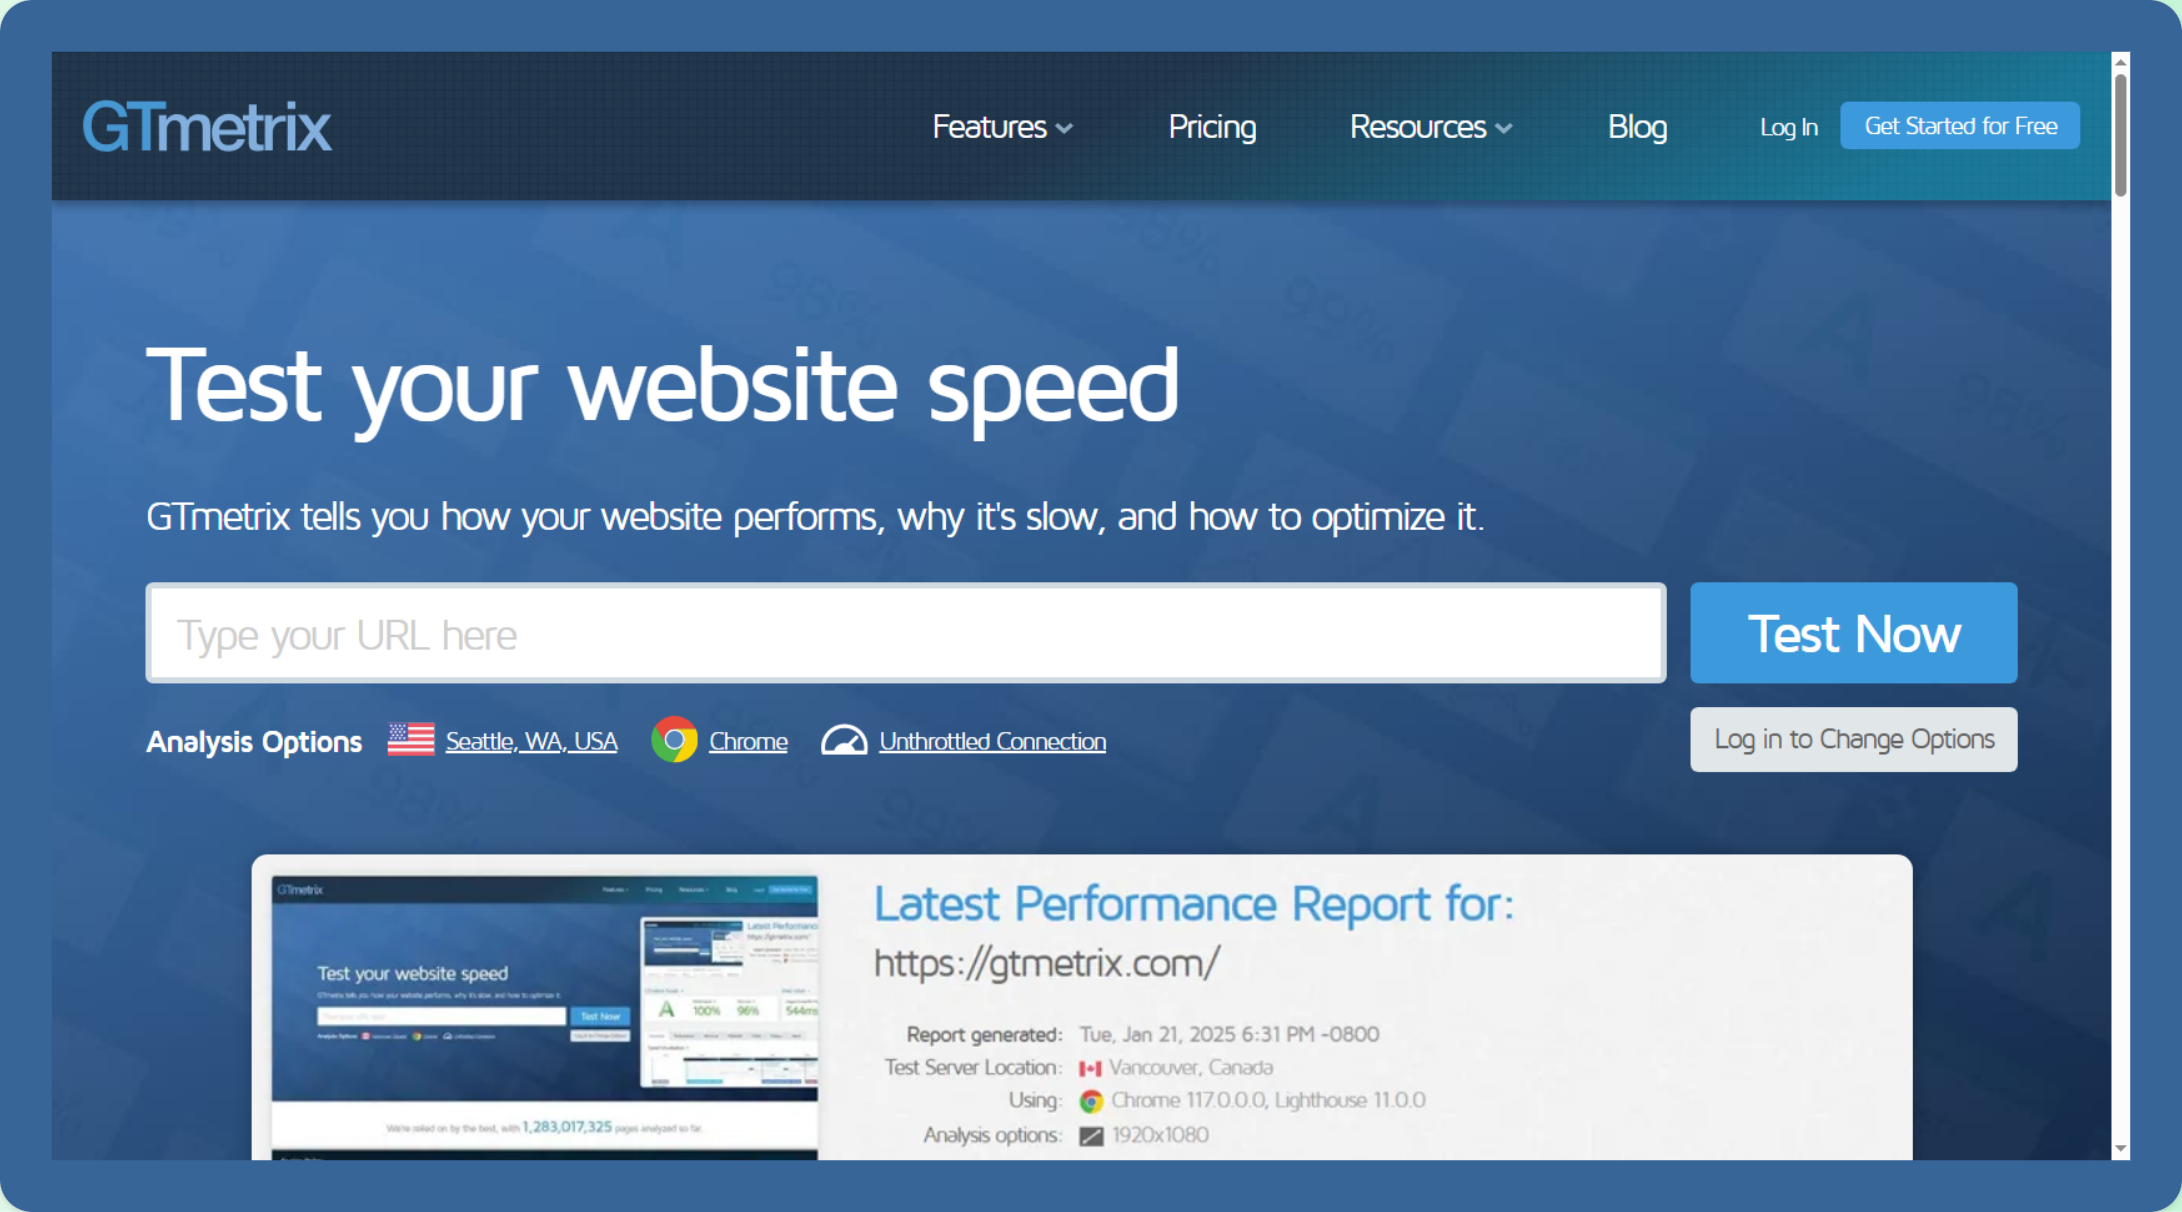
GTmetrix
The tool is widely used because it provides detailed visual reports showing exactly how a page loads.
One of its most useful features is the waterfall chart, showing how each resource loads and how long it takes.
This makes it easier to identify problems such as:
• oversized images
• blocking scripts
• slow server response times
• excessive requests
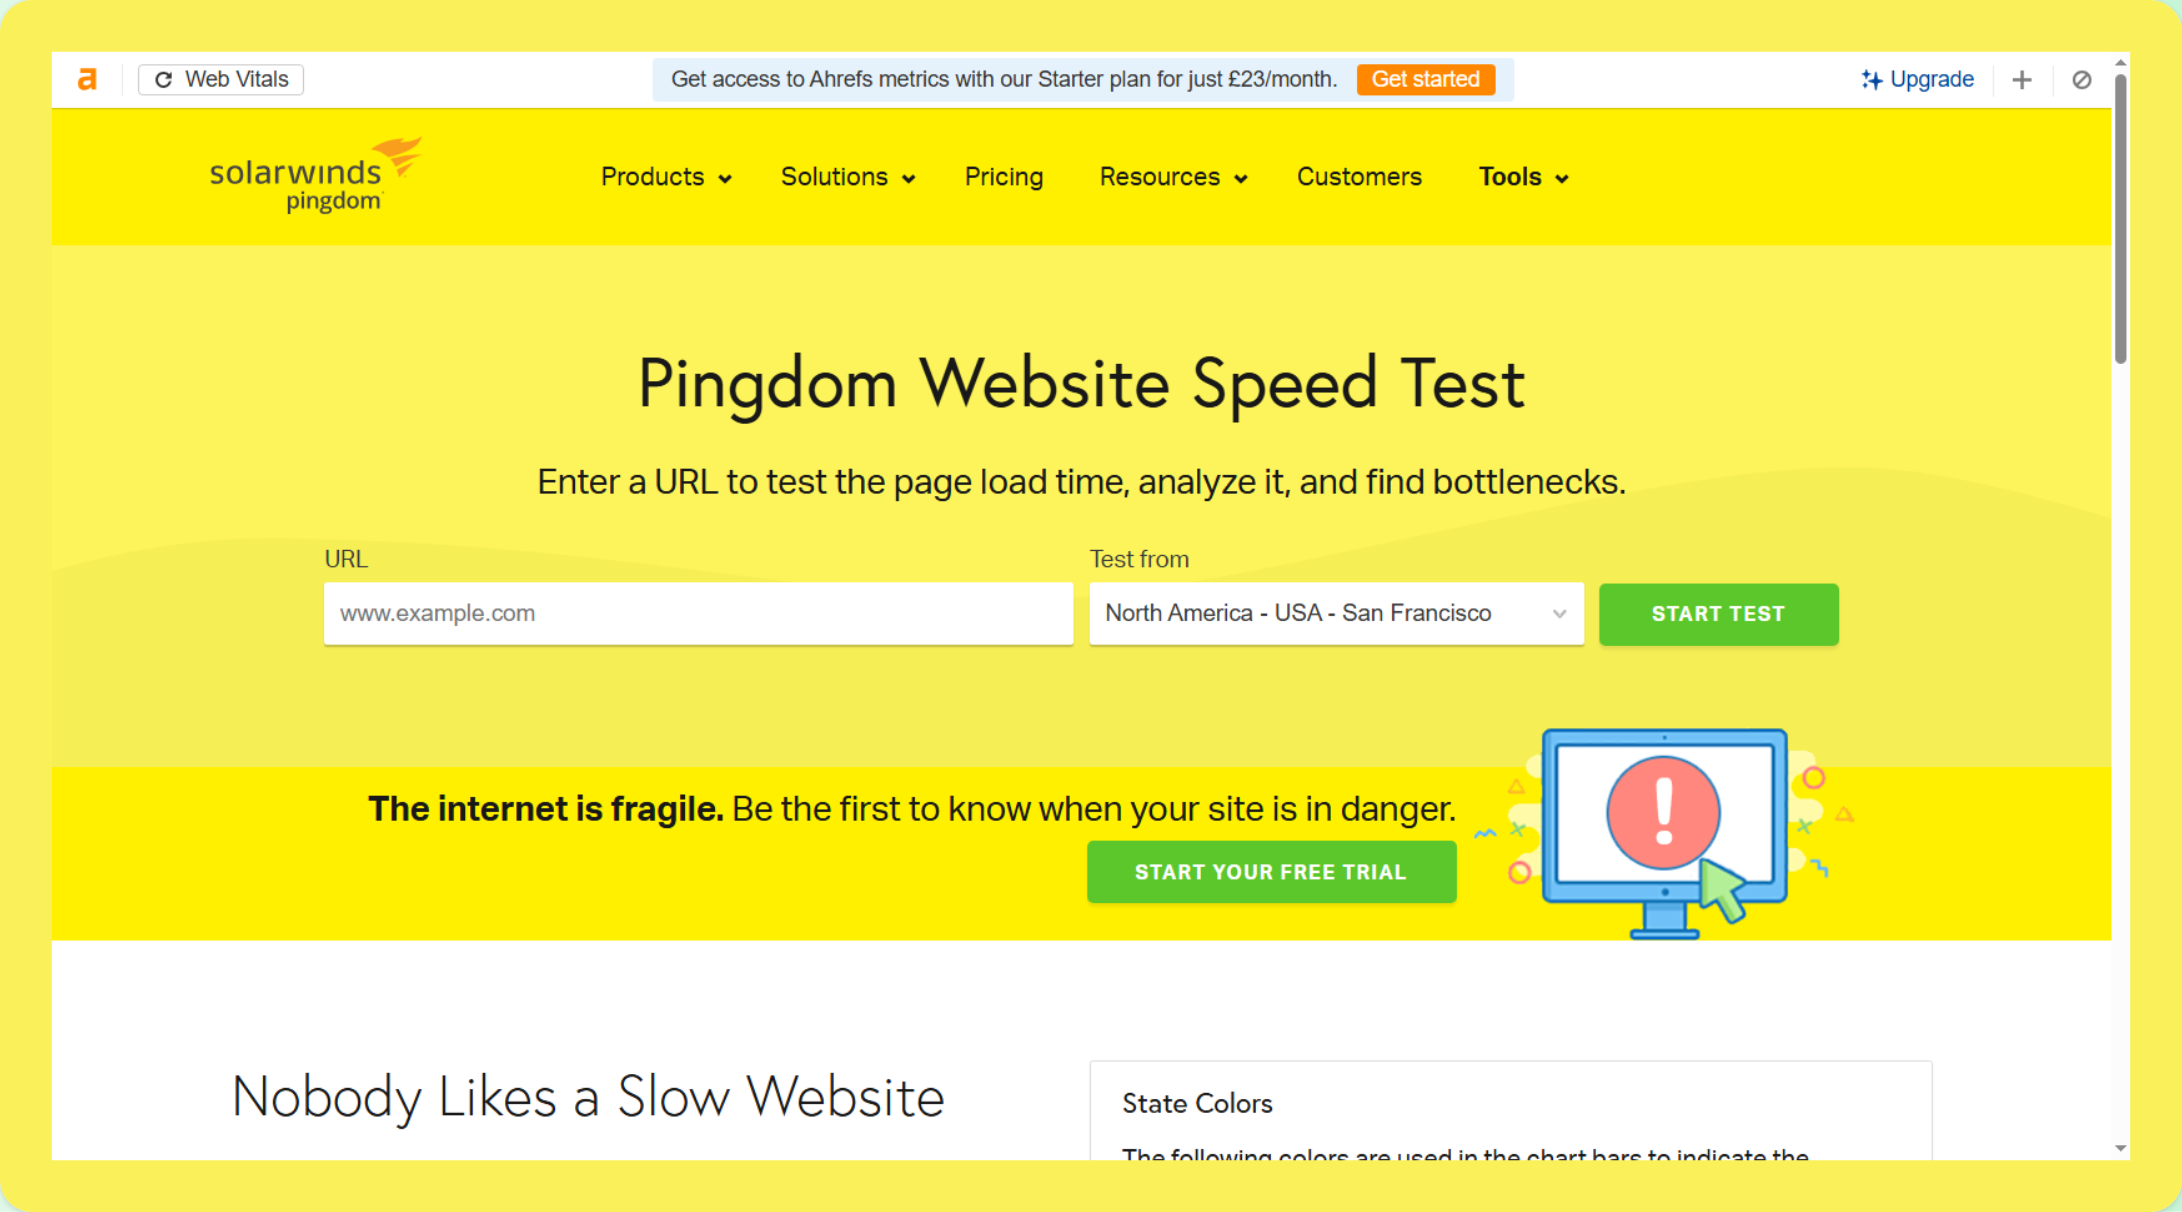
Pingdom
It provides a straightforward website speed test that focuses on page loading time and overall performance.
It measures:
• total load time
• page size
• number of requests
Because the reports are simple and easy to understand, Pingdom is often used for quick performance checks.
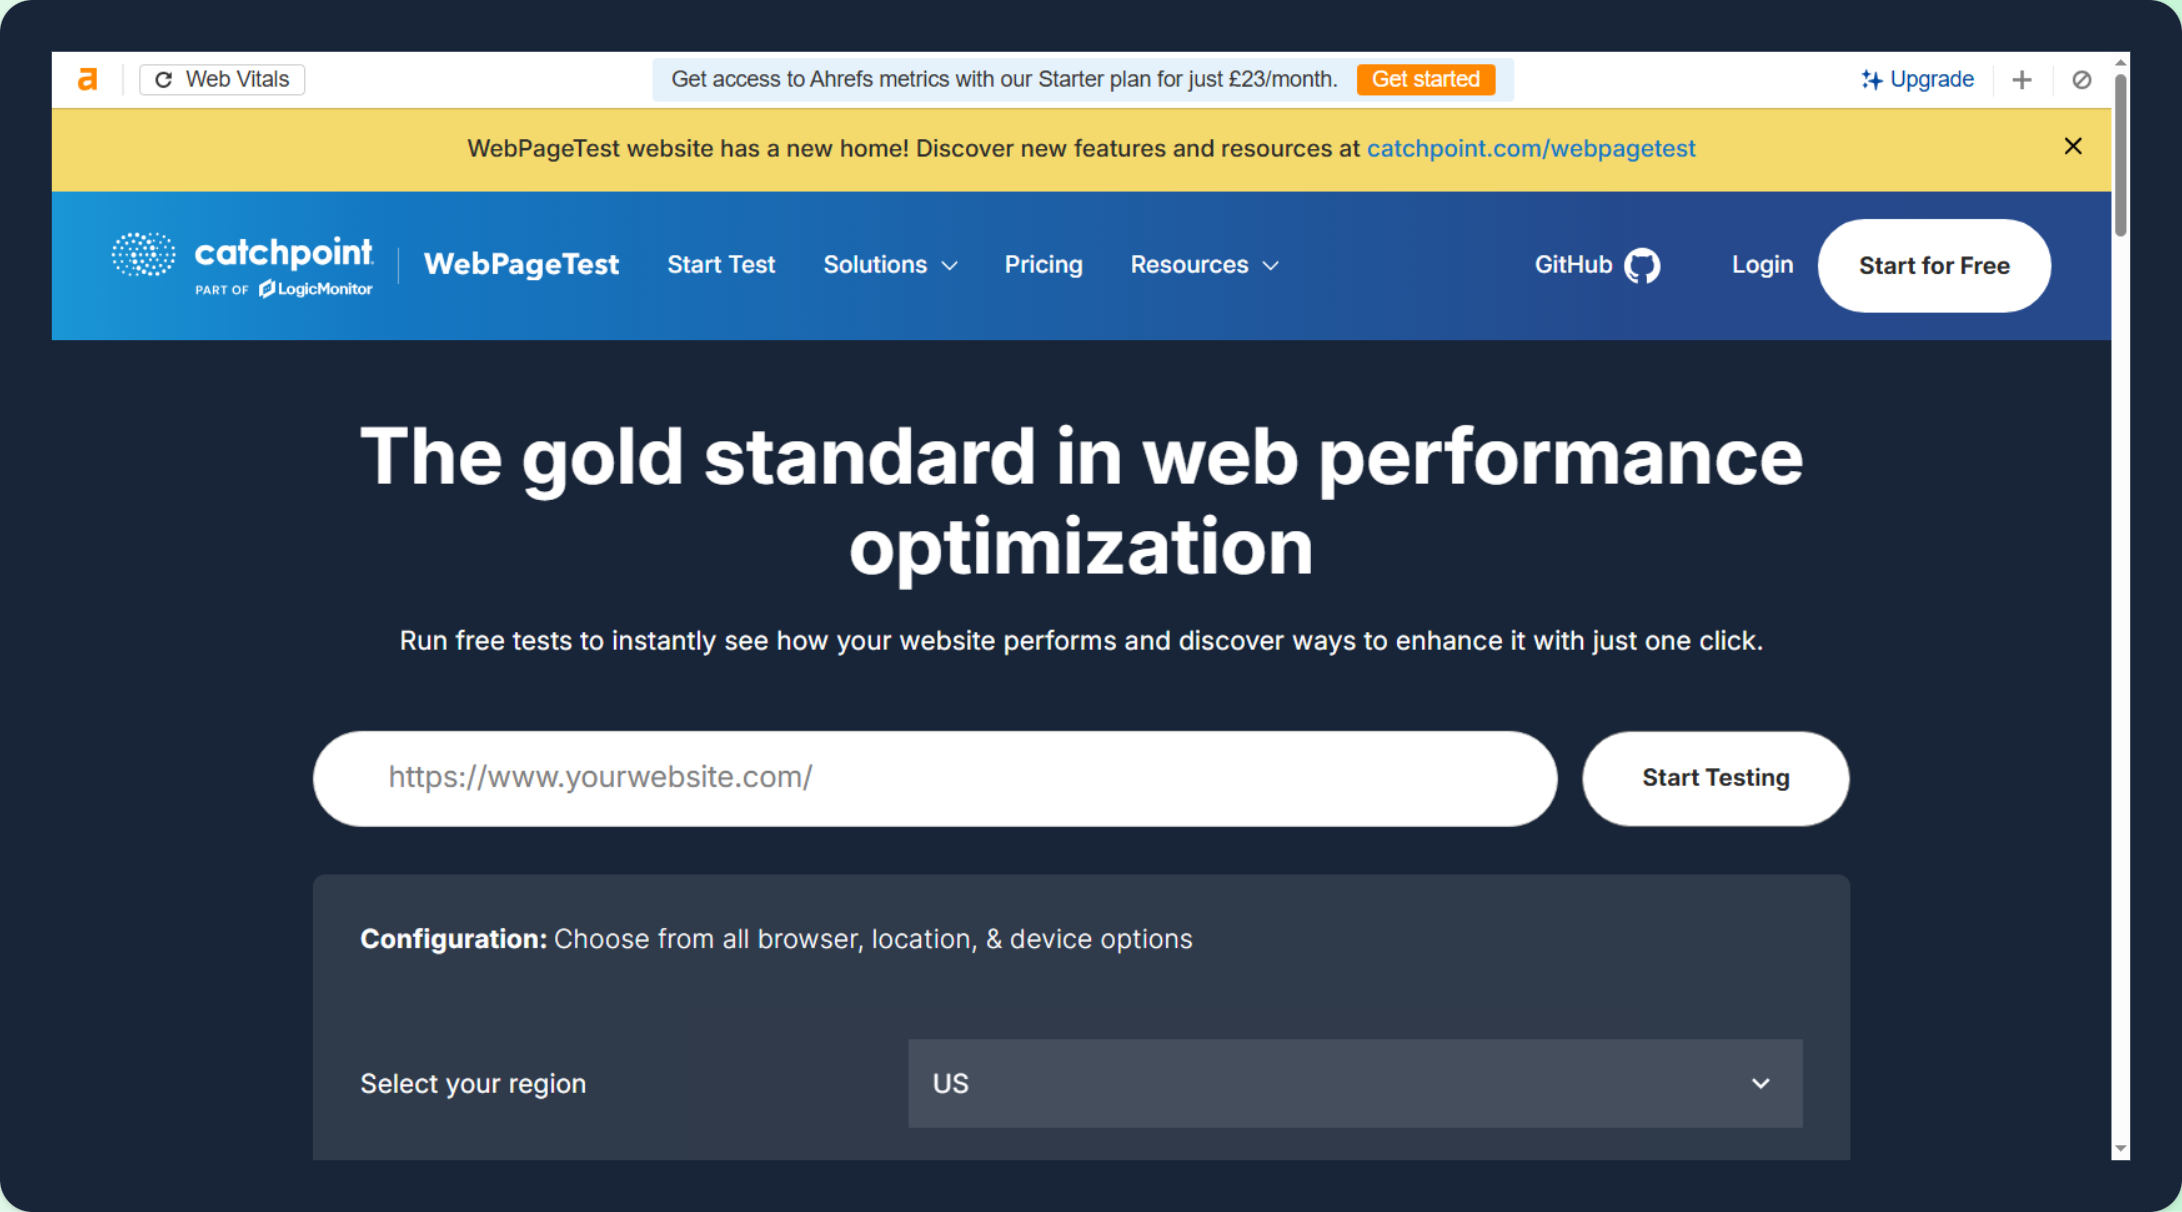
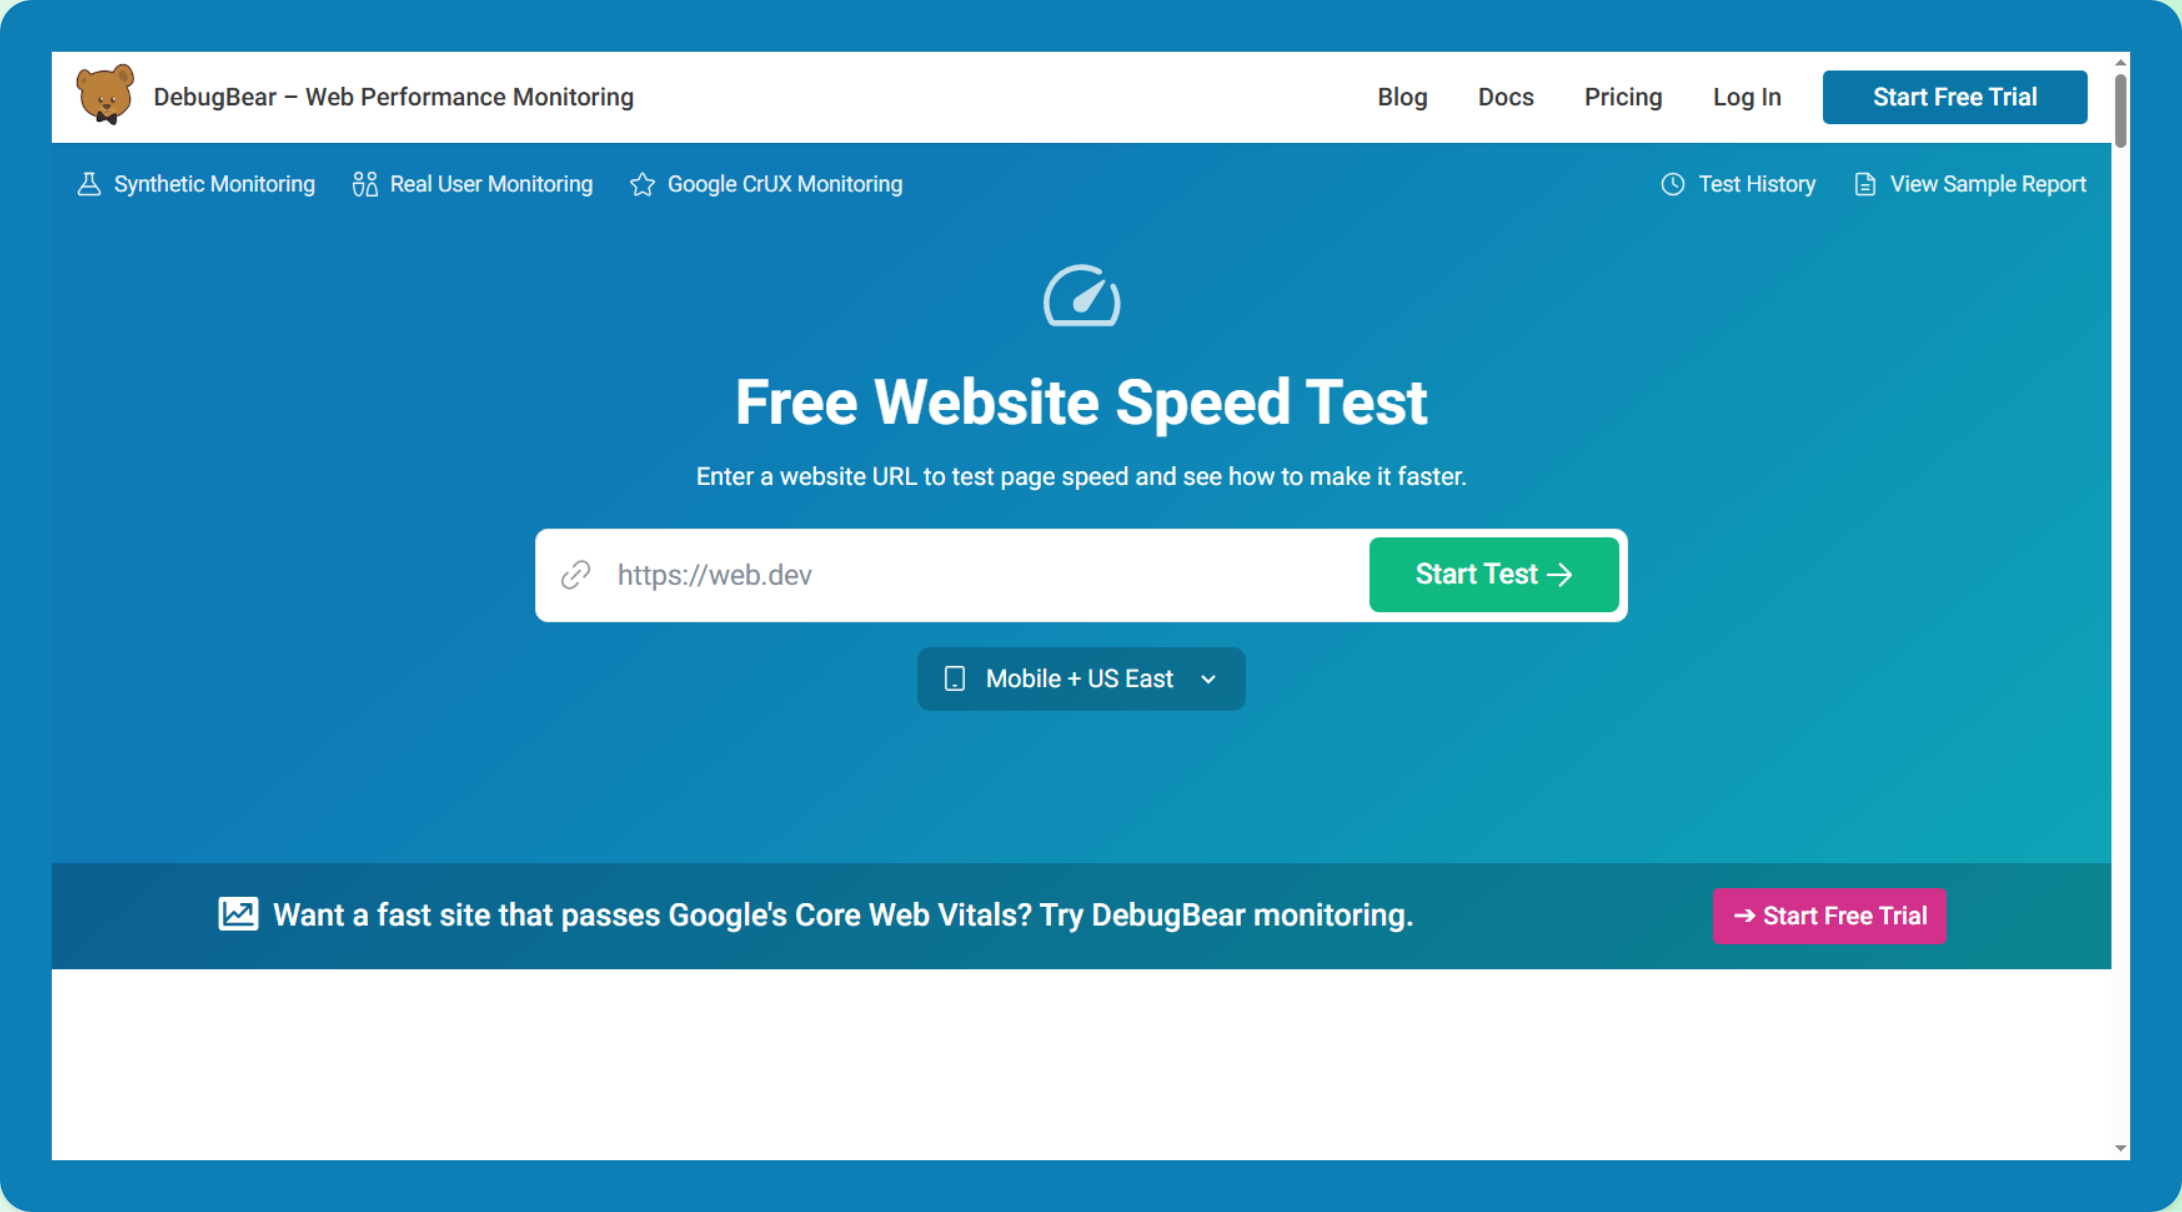
WebPageTest
The tool is among the most advanced for analysing website speed.
It allows testing from multiple global locations, devices, and network conditions.
WebPageTest also provides filmstrips showing how a page loads visually, which helps identify rendering problems.
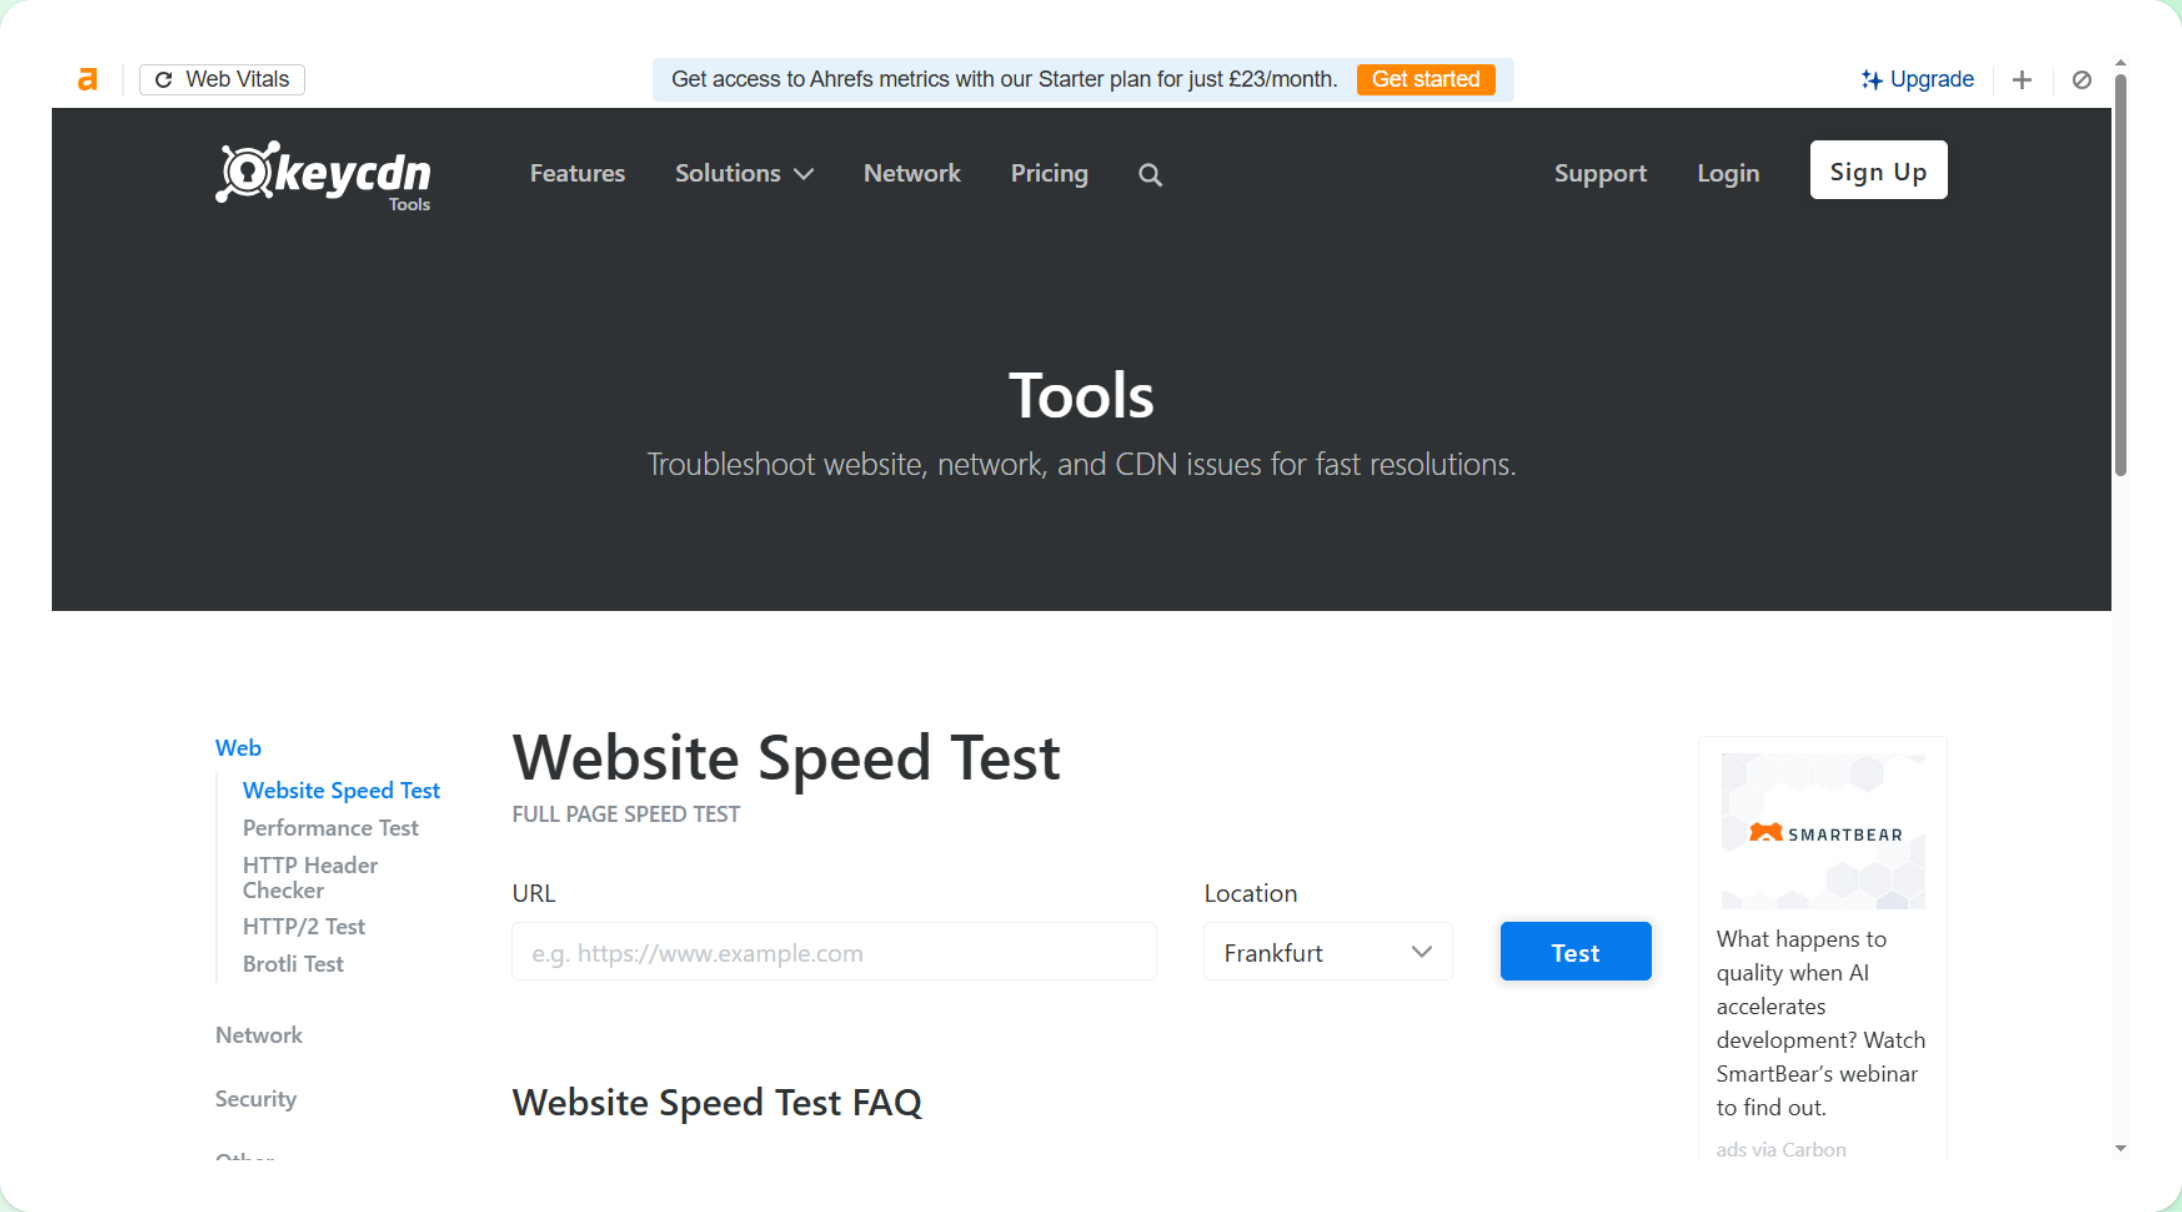
KeyCDN Website Speed Test
The KeyCDN speed test tool allows users to analyse website loading behaviour from multiple testing locations.
It provides insights into request timing and network performance.
This makes it useful for quick diagnostics and CDN-related performance checks.
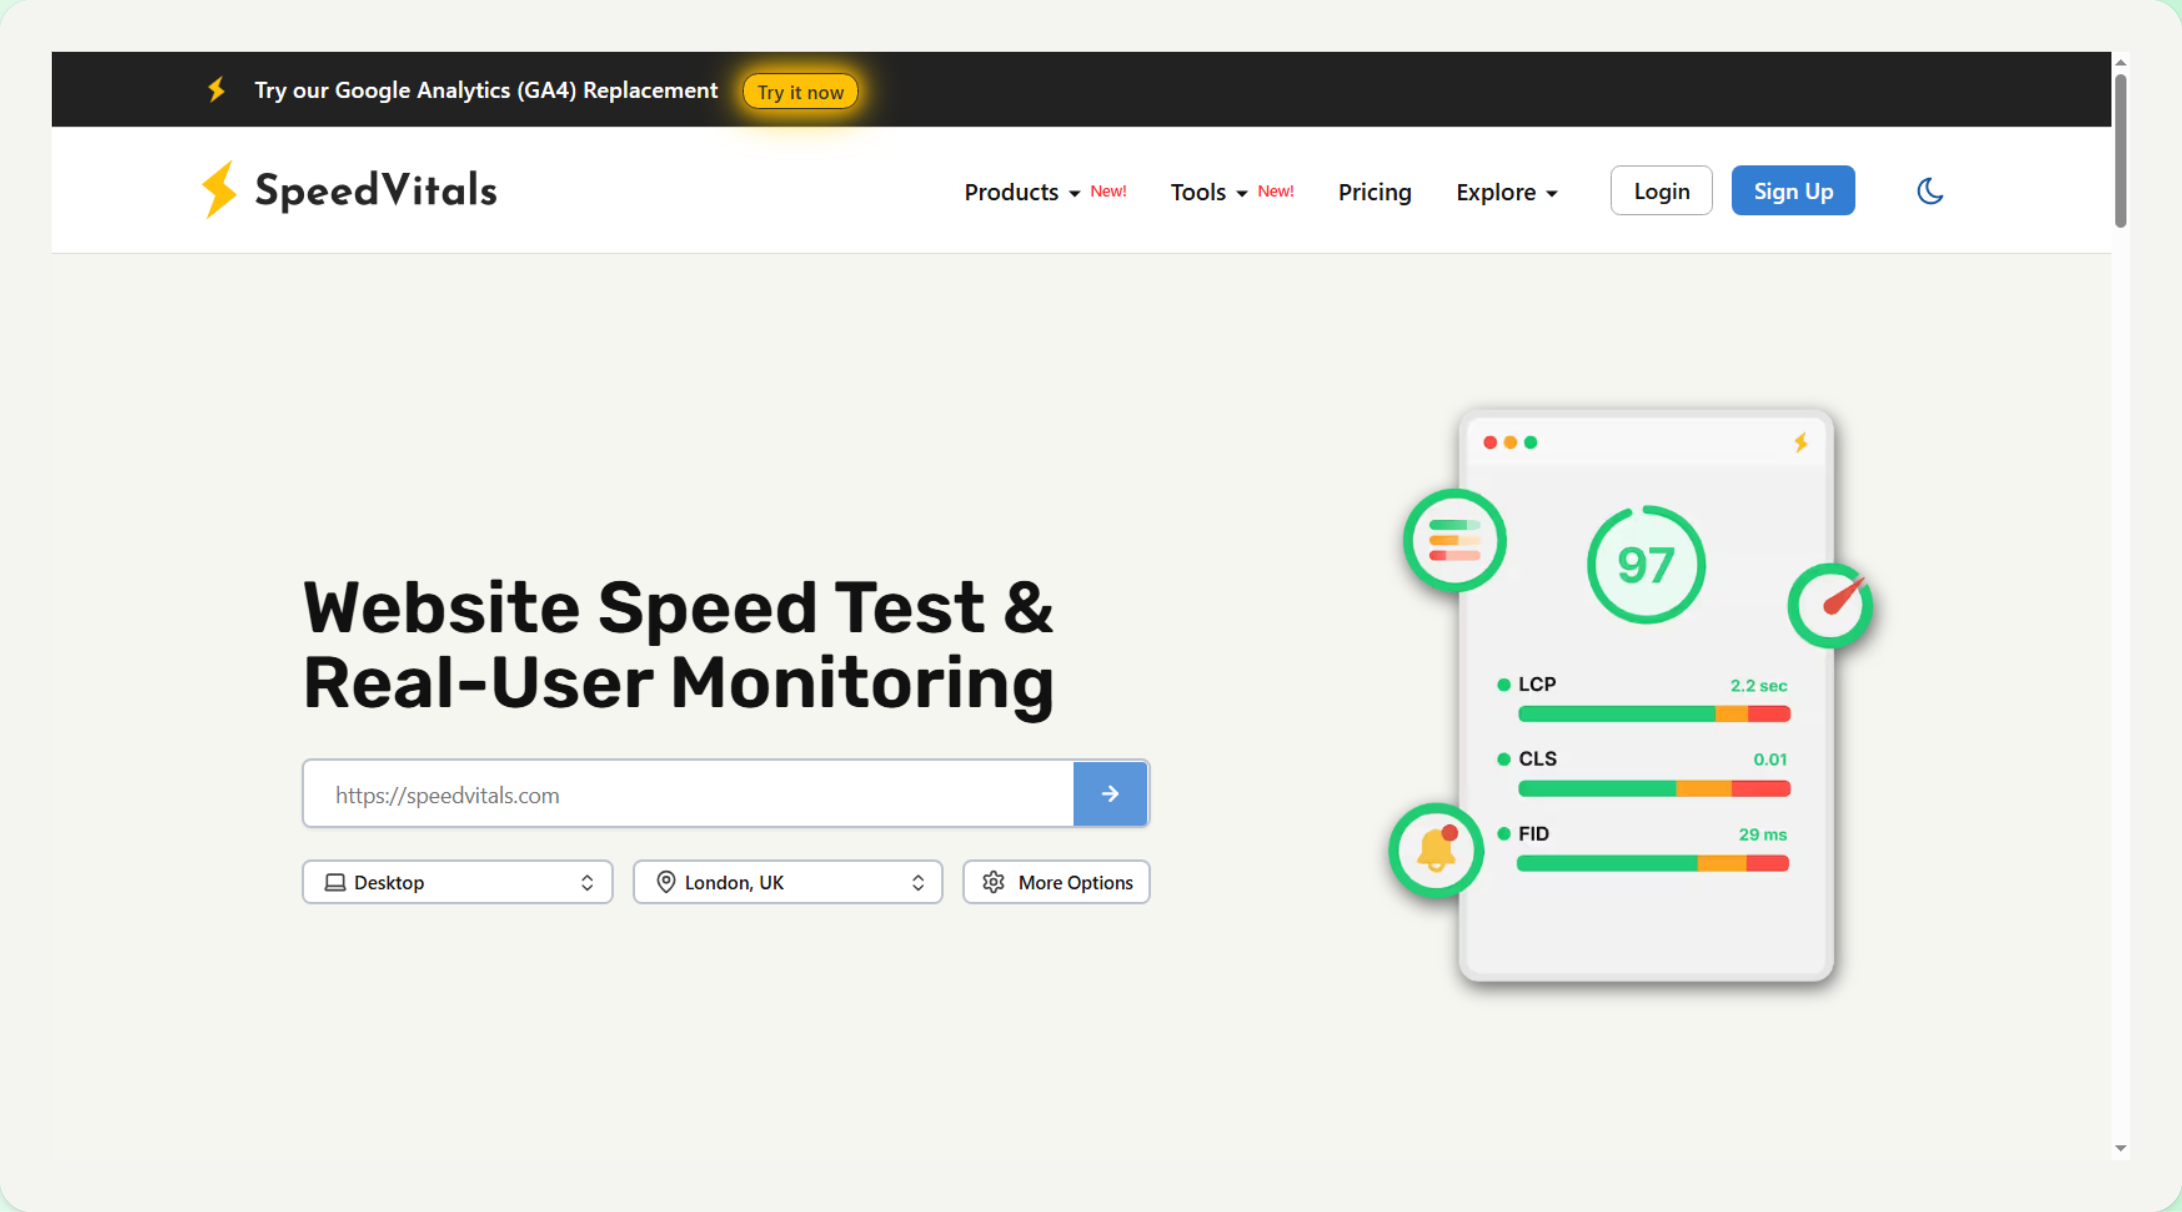
SpeedVitals
This tool aggregates results from several testing engines.
This allows users to compare results across different speed testing methodologies.
It can provide additional perspective when evaluating website performance.
Uptrends
The tool focuses on performance monitoring and uptime tracking.
Instead of relying only on single tests, it allows website owners to monitor speed trends over time.
This can help identify intermittent performance problems.
DebugBear
This combines synthetic testing with real user monitoring.
This allows performance teams to track Core Web Vitals and identify performance regressions.
Tools like DebugBear are often used for long-term performance monitoring.
Why Speed Testing Tools Give Different Results
Many website owners notice that different speed testing tools report different scores.
This happens because tools use different testing environments, devices, and network conditions.
Some tools simulate mobile performance, while others test desktop environments. Some tools focus on diagnostic metrics, while others focus on real user data.
Because of this, results often vary between tools.
Comparing results across several testing platforms usually provides the clearest understanding of how a website performs.
What Are The Best PageSpeed Tools To Use?
Each website speed testing tool measures performance slightly differently.
PageSpeed Insights focuses on Google’s Core Web Vitals metrics. Tools such as WebPageTest and GTmetrix provide deeper technical diagnostics. Monitoring tools such as Uptrends and DebugBear track performance trends over time.
For most website owners, the best approach is to compare results from multiple tools rather than relying on a single report.
PageSpeed Insights remains the most important reference point because it measures the metrics that Google uses to evaluate real user experience.
Final Thoughts
There is no single website speed testing tool that provides every answer.
PageSpeed Insights is the best starting point because it measures Core Web Vitals. Other tools provide valuable diagnostics that help identify performance bottlenecks.
Understanding how these tools work together is the key to improving website speed and delivering a better user experience.