You’ve followed the advice, but still your site feels slow.
Optimised images. Minified scripts. Reduced HTTP requests.
Now PageSpeed Insights gives you a high score.
Updated 27th April 2026
Read our PageSpeed Insights guide
If you’re seeing a green PageSpeed score but users complain about performance, you’re not imagining things. A high score does not always mean a fast site, especially not in the real world.
This article explains why that happens and what to focus on instead.
FIRSTLY
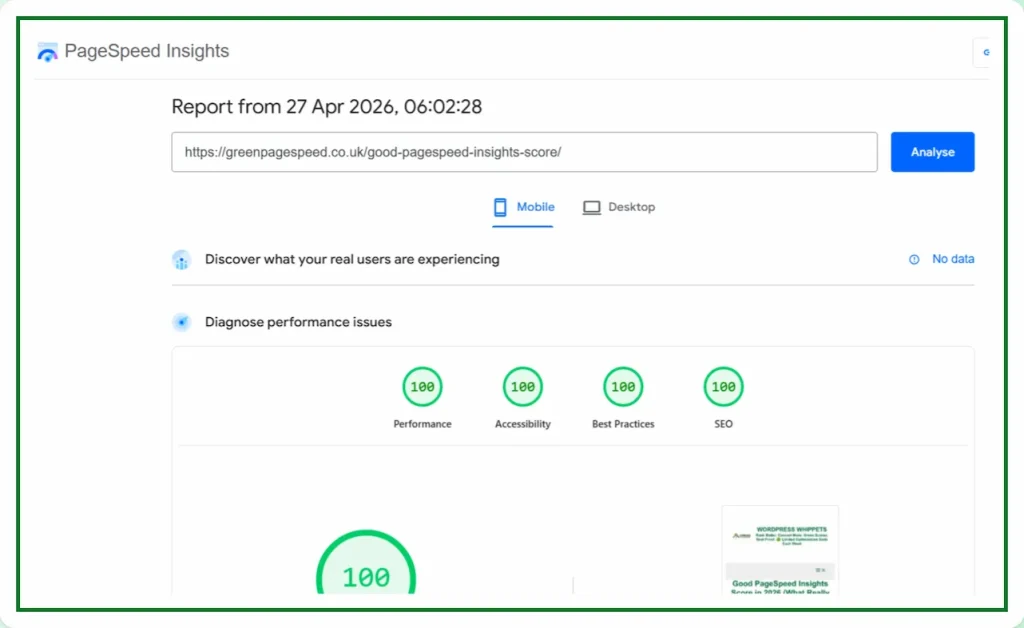
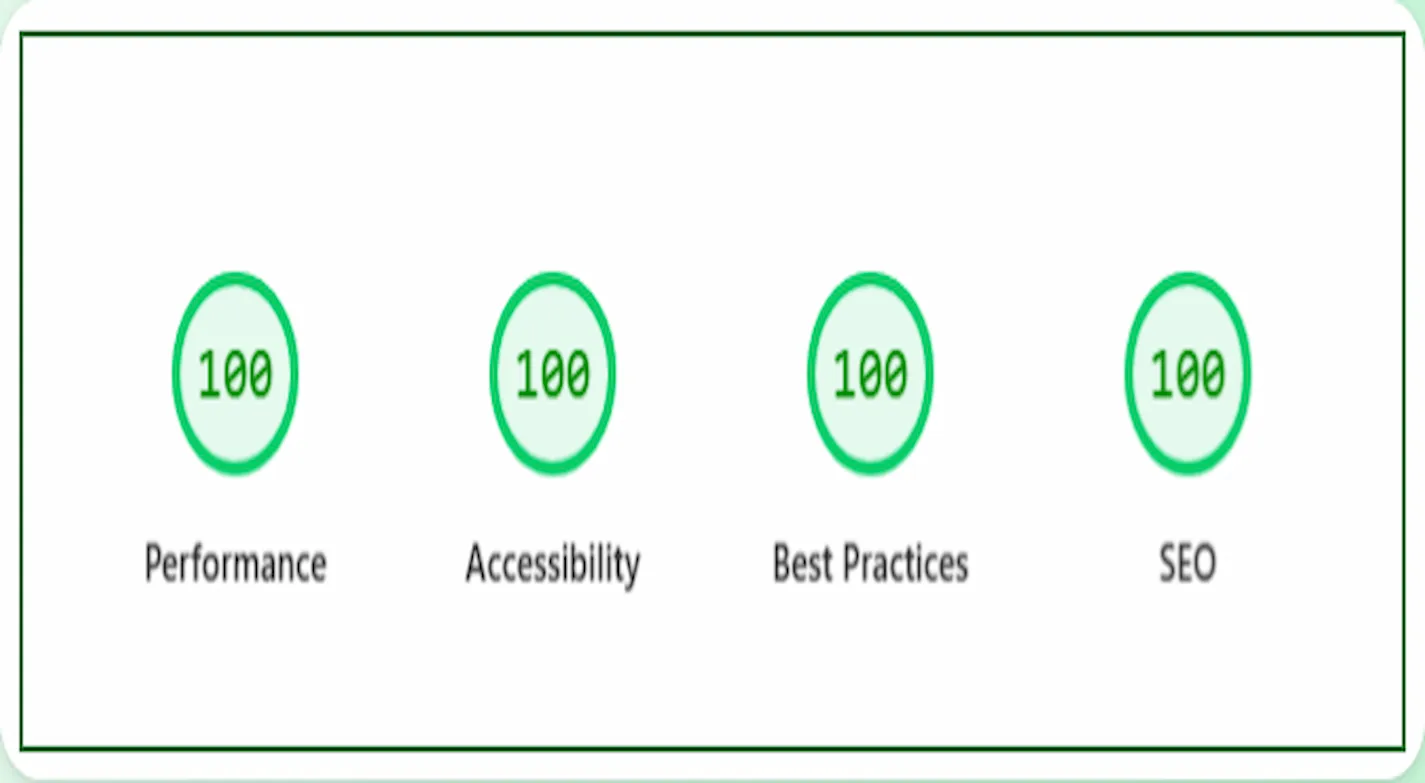
Run a Google PageSpeed Test for Your Website
(Free Tool Below)
⚠️MOST WEBSITES SCORE UNDER 50
HOW ABOUT YOURS?
✅ Independently verified by Google PageSpeed
Try a FREE website speed check below
🔗 TEST YOUR SITE SPEED NOW
**PSI is a testing tool, not an endorsement.**
GreenPageSpeed was recently featured on
Asset CleanUp’s customer testimonials page
We were also featured on WPX’s hosting website.
A true testament to our unparalleled speed optimisation.
You can read what they say:-
WPX APPRAISAL
Lab Scores vs Real-World Feel
PageSpeed Insights runs your page through a tool called Lighthouse. It performs a test in a controlled environment, often on a simulated mobile device with a throttled network and CPU.
That score reflects how your site performs in that specific test. It does not reflect real-world performance across thousands of devices, locations, or user behaviours.
Google knows this. That’s why they evaluate websites using Core Web Vitals, a set of user-centric performance metrics based on actual visitor data.
Core Web Vitals Matter More Than the Score
If you care about user experience and SEO, these are the metrics that matter:
-
LCP (Largest Contentful Paint) – how fast the main content becomes visible
-
CLS (Cumulative Layout Shift) – how stable the layout is during load
-
INP (Interaction to Next Paint) – how quickly your site responds to clicks and taps
These metrics are collected from real users in Chrome, not simulated tests. They are what Google uses to assess speed in its ranking algorithm.
A high PageSpeed score with poor Core Web Vitals is possible, and it’s common.
What Makes a Site Feel Slow
Speed is not just about technical load time. It’s about how fast your site appears usable and how quickly it responds when someone interacts with it.
Even with a PageSpeed score in the 90s, your site can feel slow if:
-
Content takes too long to appear
-
Fonts load late or flash during rendering
-
Images pop in after the page loads
-
Menus and buttons lag when clicked
-
Layout shifts cause buttons to move during interaction
-
Animations or scripts delay user input
These are performance issues that affect user perception, even if the test says your site is fast.
Why This Happens
There are several reasons your site might feel slow even though it scores highly on PageSpeed Insights.
1. Lazy Loading Misuse
Lazy loading is helpful for long pages, but if your top images or above-the-fold content are lazy loaded, it delays visual completeness.
Fix: Exclude the first image and logo from lazy loading.
2. Fonts Load Too Late
Fonts from Google or external services are often render-blocking unless handled properly.
Fix: Self-host fonts and preload key styles.
3. Excessive JavaScript
Most themes and plugins load unnecessary JavaScript on every page. While deferred scripts may not affect lab tests, they can still delay interactivity for users.
Fix: Unload scripts where not needed using plugins like Asset CleanUp or Perfmatters.
We Compared PageSpeed Tests, So You Don’t Have To
We’ve also compared PageSpeed Insights with other popular speed tools – check them out below:
Firstly, PageSpeed Insights: Mobile vs Desktop
Then
PageSpeed Insights vs DebugBear
Then
Also
PageSpeed Insights vs WebPageTest
And
PageSpeed Insights vs SpeedVitals
Also
PageSpeed Insights vs Uptrends
As well as
Finally
PageSpeed Insights vs Lighthouse
4. Third-Party Scripts Load After the Test
Many scripts load after the PageSpeed score is generated, but still affect the user experience. Examples include chat widgets, analytics, or A/B testing tools.
Fix: Load them on user interaction, or delay them until after the page becomes interactive.
5. Shared Hosting Inconsistencies
Lab tests may hit your server during a low-traffic period, but real users encounter load spikes, high CPU usage, or poor TTFB on shared hosting.
Fix: Upgrade to a performance-optimised host, or use a CDN with edge caching.
6. Mobile Experience Is Not Optimised
Your desktop view might be fast, but real users on mobile networks or older devices experience very different results.
Fix: Always test on actual mobile devices, not just browser emulators.
What to Prioritise Instead of the Score
If your site feels slow, do not focus on increasing your PageSpeed number. Focus on what users actually experience when they visit your site.
You Should Focus On:
-
Making content visible within 2.5 seconds (LCP)
-
Eliminating layout shifts (CLS below 0.1)
-
Ensuring instant response to user input (INP under 200ms)
-
Using compressed, modern image formats (WebP or AVIF)
-
Hosting fonts locally and preloading them
-
Removing unused scripts and styles
-
Keeping above-the-fold content clean and fast
These changes will improve both field data and perceived speed.
How to Measure Real Performance
To see what users are actually experiencing, go beyond PageSpeed Insights.
Use:
-
Google Search Console – Core Web Vitals Report
-
PageSpeed Insights – Scroll down to “Field Data”
-
WebPageTest.org – Shows filmstrips and user timing
-
Real device testing – Use your phone on mobile data
-
Chrome DevTools – Performance tab to simulate real-world issues
These tools will give you a clearer picture of where to improve.
Final Thoughts
PageSpeed scores help spot technical issues, but they should not be your primary performance goal. Google ranks sites based on field data, not synthetic tests.
If your site feels slow, that’s a user experience issue, and user experience is what drives real SEO results.
Focus on metrics that matter. Use real user data. Test on real devices. And make sure your site performs well for actual visitors, not just bots. If the site feels slow, still, implement the advice given in this article.
For a full breakdown of PageSpeed Insights, including screenshots and step-by-step fixes, visit our guide: