PageSpeed Insights vs WebPageTest: Your differences, Field vs Lab results explained.
A clear workflow so the numbers agree.
Updated 14th March 2026
Click here, and then view the green PageSpeed tests proof wall and scroll down.
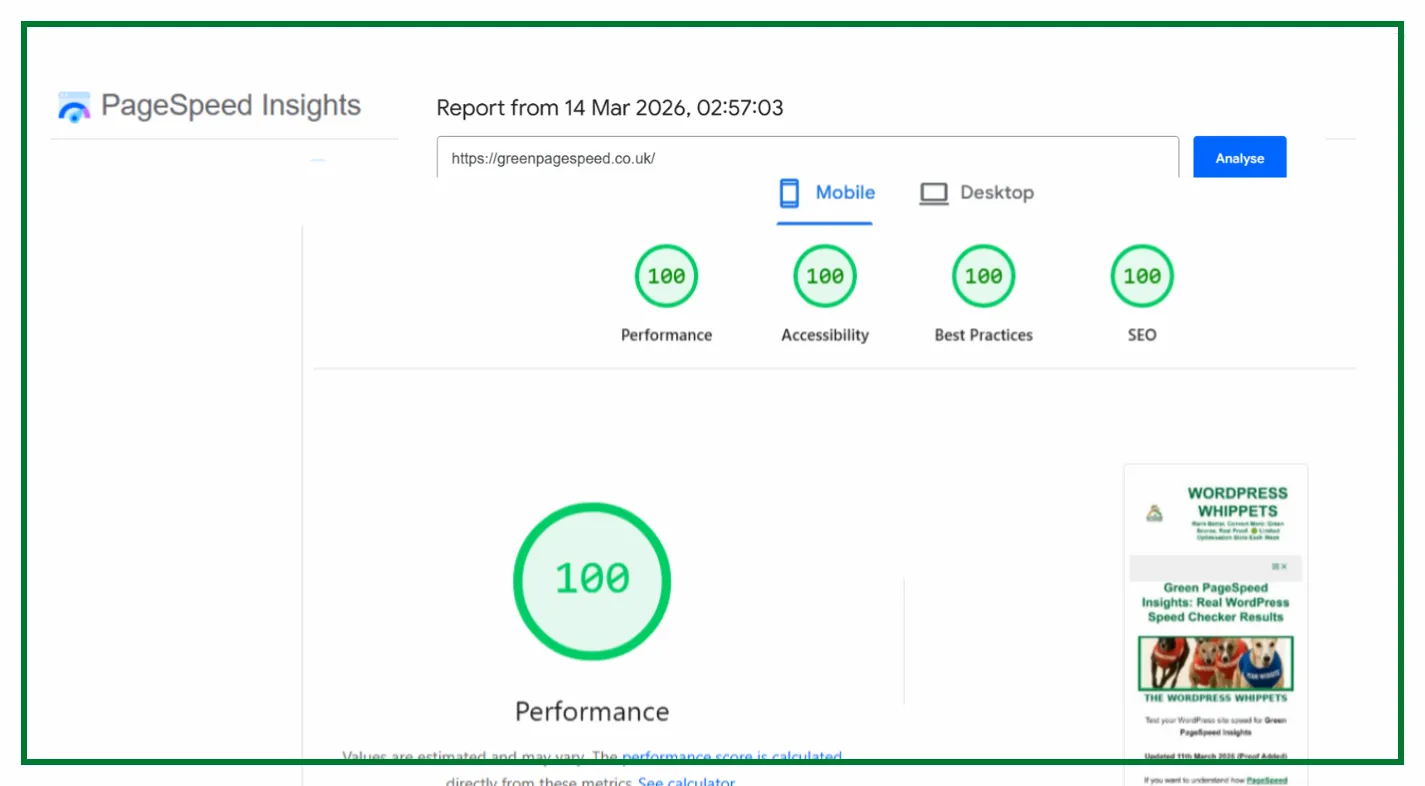
Run a Google PageSpeed Test for Your Website (Free Tool Below)
⚠️MOST WEBSITES SCORE UNDER 50
HOW ABOUT YOURS?
✅ Independently verified by Google PageSpeed
Try a FREE website speed check below
🔗 TEST YOUR SITE SPEED NOW
**PSI is a testing tool, not an endorsement.**
And then,
If you want to read much more about the PageSpeed Insights tool. Click that link.
A genuine endorsement of our performance work
You can read the official WPX appraisal below.
WPX APPRAISAL
One Job P/Day =FULL FOCUS
We only take on one website per day, because rushing speed work doesn’t cut it.
Your site gets our full focus, and every detail is tuned for performance.
This hands-on approach consistently changes your PSI scores to green. It boosts Google rankings.
You will attract more traffic, more visibility, and ultimately, more business.
However, the good news is that once you know how to use Google PageSpeed Insights properly,
You’ll uncover exactly what’s dragging your site down and how to fix it for good.
Afterwards, look at the homepage and check out the full service that delivers the results shown on the “Live Results” page. (Updated Daily)
You pay upfront, and we do the work fast.
There are no hidden costs.
✅ Mobile-first
✅ Core Web Vitals fixed
✅ Google Green scores achieved
✅ Before & after proof
✅ 100% UK-based, WordPress-only service
✔️ GREEN SCORES, OR YOUR MONEY BACK✔️
“Can you guarantee I’ll get green PageSpeed Insights scores?”
Without a doubt, we guarantee a significant speed boost.
Most clients achieve scores of 90–100 on Google PageSpeed Insights.
If we fail to deliver green results across the core metrics, you’ll receive a full refund.
Our daily proof results reinforce these real scores.
Need Help Understanding Your PSI Score?
We specialise in WordPress speed optimisation based on real PageSpeed Insights results.
Our daily proof updates show it’s repeatable, and not luck.
However, which one should you use, and when do you use the tool?
PageSpeed Insights (PSI) for Google-aligned Core Web Vitals with real-user Field data (CrUX).
Use WebPageTest (WPT) when you need a forensic lab analysis. Check waterfalls, filmstrips, priorities.
Then you can see fine-grained test profiles to pinpoint what blocks rendering..
Key differences at a glance
| Feature | PageSpeed Insights (PSI) | WebPageTest (WPT) |
|---|---|---|
| Core Web Vitals focus | LCP / INP / CLS (Field + Lab view) | Vitals in traces + filmstrip context |
| Field (real-user) data | Yes (CrUX) | Lab only (test agents) |
| Waterfalls/filmstrip | Basic | Advanced + visual filmstrip |
| Profiles & throttling | Standard Lighthouse settings | Highly customisable devices/locations |
| Best for | Google’s perspective & quick decisions | Forensics & render-path tuning |
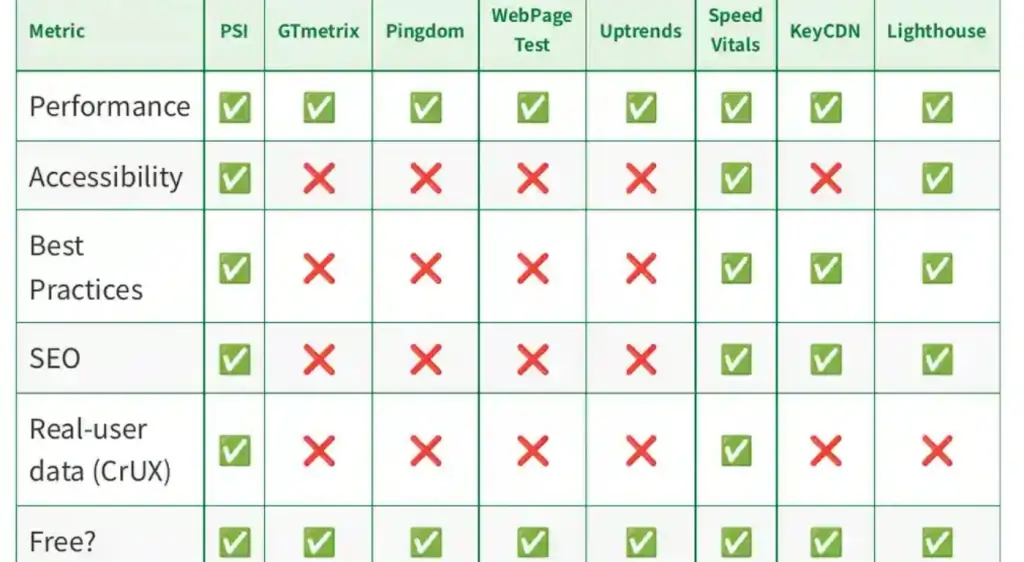
We Compared PageSpeed Tests, So You Don’t Have To
We’ve also compared PageSpeed Insights with other popular speed tools – check them out below:
Firstly, PageSpeed Insights: Mobile vs Desktop
Then
PageSpeed Insights vs DebugBear
Then
Also
PageSpeed Insights vs WebPageTest
And
PageSpeed Insights vs SpeedVitals
Also
PageSpeed Insights vs Uptrends
As well as
Finally
PageSpeed Insights vs Lighthouse
Let’s break it down and find out why PageSpeed Insights is still the best option in 2025.
When to use PageSpeed Insights
Start with PSI to understand the reality your users face.
The Field panel (CrUX) shows your 75th-percentile LCP/INP/CLS; the Lab panel (Lighthouse) estimates where you’ll improve. Use PSI when you need to:
Confirm whether real users pass Core Web Vitals
Get a clear “what to fix first” via Opportunities.
Compare URL vs Origin performance and track changes after it “deploys.”
Our WebPageTest proof (Desktop · London): LCP 0.605s, CLS 0, TBT 0.037s
https://www.webpagetest.org/

Independent WebPageTest results confirm Green PageSpeed’s performance.
With a First Contentful Paint of just 0.6 seconds, an LCP under 0.7 seconds, and perfect stability (CLS 0),
Our site loads in under a second. all while keeping page weight lean.
These benchmarks prove our optimisations deliver real-world speed, not just lab scores
When to use WebPageTest
WebPageTest is a powerful tool for understanding the why.
It reveals blocking requests, priority inversions, and layout/rendering behaviour.
Two things you can’t see from a single Lighthouse run.
Use it when you need:
- Filmstrips to visualise render start, LCP element reveal, and CLS jumps.
- Waterfalls showing DNS/TLS/TTFB, caching, and protocol hints (e.g., HTTP/2 prioritisation).
- Custom profiles: test locations, devices, bandwidth/latency, repeat views, and script steps.
FAQs
Should I rely only on the PSI score?
No. Treat the score as a headline. Always check the field data (CrUX) and your Core Web Vitals status.
When is WebPageTest essential?
When you’re chasing down poor LCP/TBT, render-blocking, or third-party scripts, waterfalls + filmstrips make bottlenecks obvious.
Which tool helps SEO more?
None will be directly achieved; however, achieving green Core Web Vitals helps users and SEO.
We aim for stable green results rather than promising a perfect 100/100.
Making PSI and WebPageTest Agree (workflow)
- Identify the failing metric in PSI Field. Is it LCP, INP, or CLS? Note the percentile values and device (mobile first).
- Open WPT. Run a test with the closest device/location to your audience. Enable filmstrip and capture waterfalls.
- Fix order & priority: set the correct resource priorities (preload the hero image & fonts), inline critical CSS, defer non-critical JS, and compress/resize the hero media. Aim to have your LCP element renderable ASAP.
- Trim main-thread work: break up long tasks (<50ms chunks), lazy-hydrate components, and delay 3rd-party tags until interaction to improve INP.
- Eliminate layout shifts: reserve static space for images/ads/embeds, set width/height attributes, and preload fonts with font-display to avoid CLS.
- Re-test in WPT to validate render/TTFB/LCP timing improvements; then re-test PSI to confirm a Field pass.
We host Green Page Speed on WPX — fast, secure, and independently tested in all our PageSpeed proofs.
Try WPX Hosting→ (affiliate link)
We used these to get our results. (Look at our live results in the main menu.)
Troubleshooting differences
- PSI worse than WPT: your real users are slower than the lab profile, or UI differs (consent banners, A/B scripts). Optimise for Field first.
- WPT worse than PSI: your test profile is harsher (slower CPU/network), or the site depends on CDN/geography. Align test settings with user reality.
- Scores vary every run: Performance is stochastic. It will run 3–5 tests, so look at medians and P75, don’t use a single number.
Best practices that help both tools
- Serve smaller, earlier LCP elements: compress/resize hero image or poster frame; avoid autoplaying heavy media; use
fetchpriority/rel=preloadcorrectly. - Reduce JS cost: remove unused scripts, split by route, and keep the main thread free for user input to improve INP.
- Stabilise layout: fixed dimensions for media, avoid layout-thrashing scripts, and load fonts predictably to keep CLS < 0.1.
FAQ
Is WebPageTest better than PSI? Neither is “better”, as they answer different questions. PSI will highlight if users pass CWV; WPT shows what to alter for good results.
Do I need both? Yes. Use PSI to set the goal (Field pass), WPT to find and verify the fixes.
Screenshots of how well our site performs over on the aptly named Green PageSpeed Insights page.