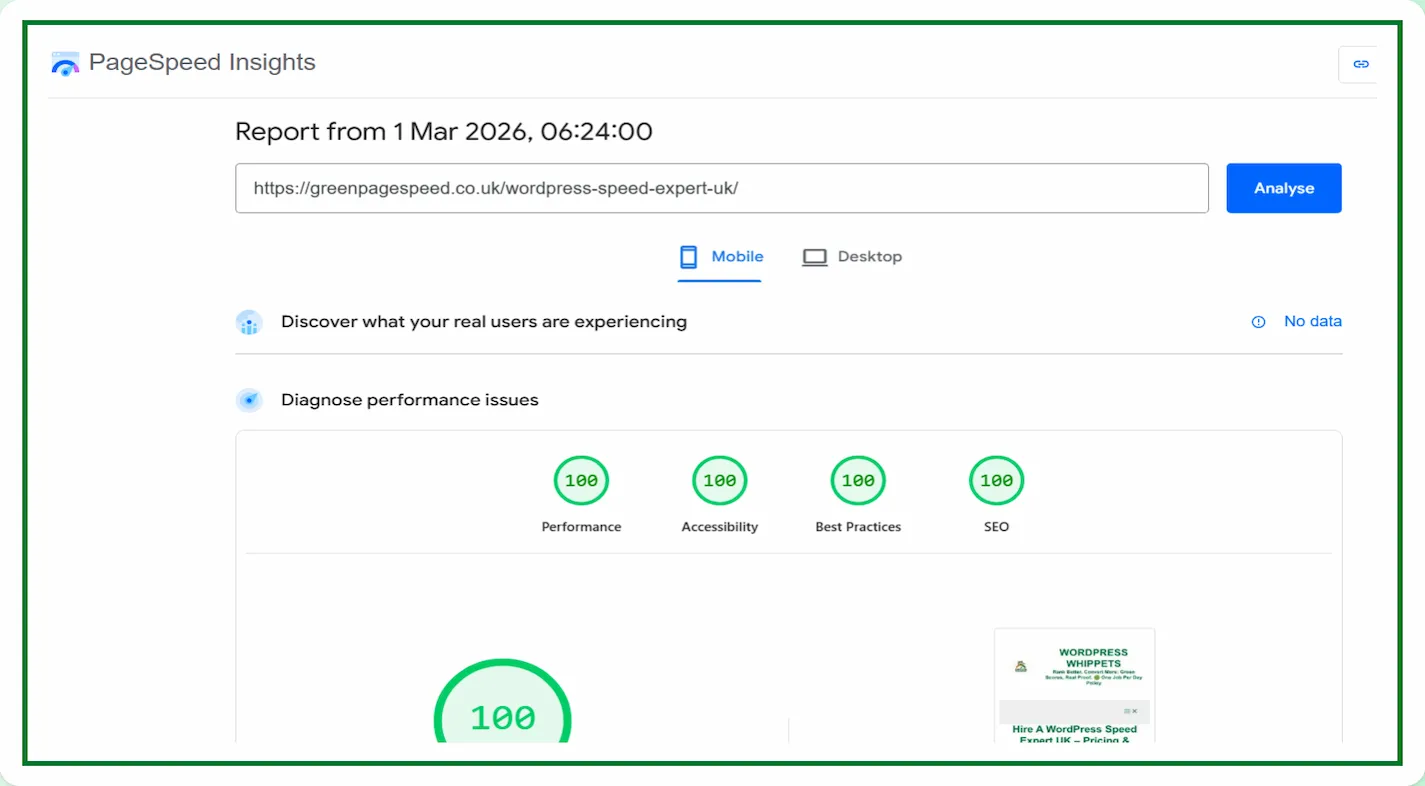
PageSpeed Insights – Mobile vs Desktop results often leave people puzzled.
You test your site and see a perfect 100 for desktop, but something lower for mobile.
That’s completely normal.
Updated 1st March 2026
If you want to learn all about PageSpeed Insights,
Then click that link for a complete explanation and get fixes.
Click Here To See More PageSpeed Tests
Run a Google PageSpeed Test for Your Website (Free Tool Below)
⚠️MOST WEBSITES SCORE UNDER 50
HOW ABOUT YOURS?
✅ Independently verified by Google PageSpeed
Try a FREE website speed check below
🔗 TEST YOUR SITE SPEED NOW
**PSI is a testing tool, not an endorsement.**
A Genuine Endorsement Of Our Performance Work
You can read the official WPX appraisal below.
WPX APPRAISAL
One Job P/Day =FULL FOCUS
We only take on one website per day, because rushing speed work doesn’t cut it.
Your site gets our full focus, and every detail is tuned for performance.
This hands-on approach consistently changes your PSI scores to green. It boosts Google rankings.
It helps you attract more traffic, more visibility, and ultimately, more business.
However, the good news is that once you know how to use Google PageSpeed Insights properly,
You’ll uncover exactly what’s dragging your site down and how to fix it for good.
Afterwards, look at the homepage and check out the full service that delivers the results shown on the “Live Results” page. (Updated Daily)
You pay upfront, and we do the work fast.
There are no hidden costs.
✅ Mobile-first
✅ Core Web Vitals fixed
✅ Google Green scores achieved
✅ Before & after proof
✅ 100% UK-based, WordPress-only service
✔️ GREEN SCORES, OR YOUR MONEY BACK✔️
Google’s tool runs in two separate environments with differing assumptions.
One for mobile and one for desktop. Below, we’ll explain why those scores vary.
We’ll also explain which version truly matters for SEO, and how to optimise your website for both tests.
We host Green Page Speed on WPX — fast, secure, and independently tested in all our PageSpeed proofs.
Try WPX Hosting (affiliate link)
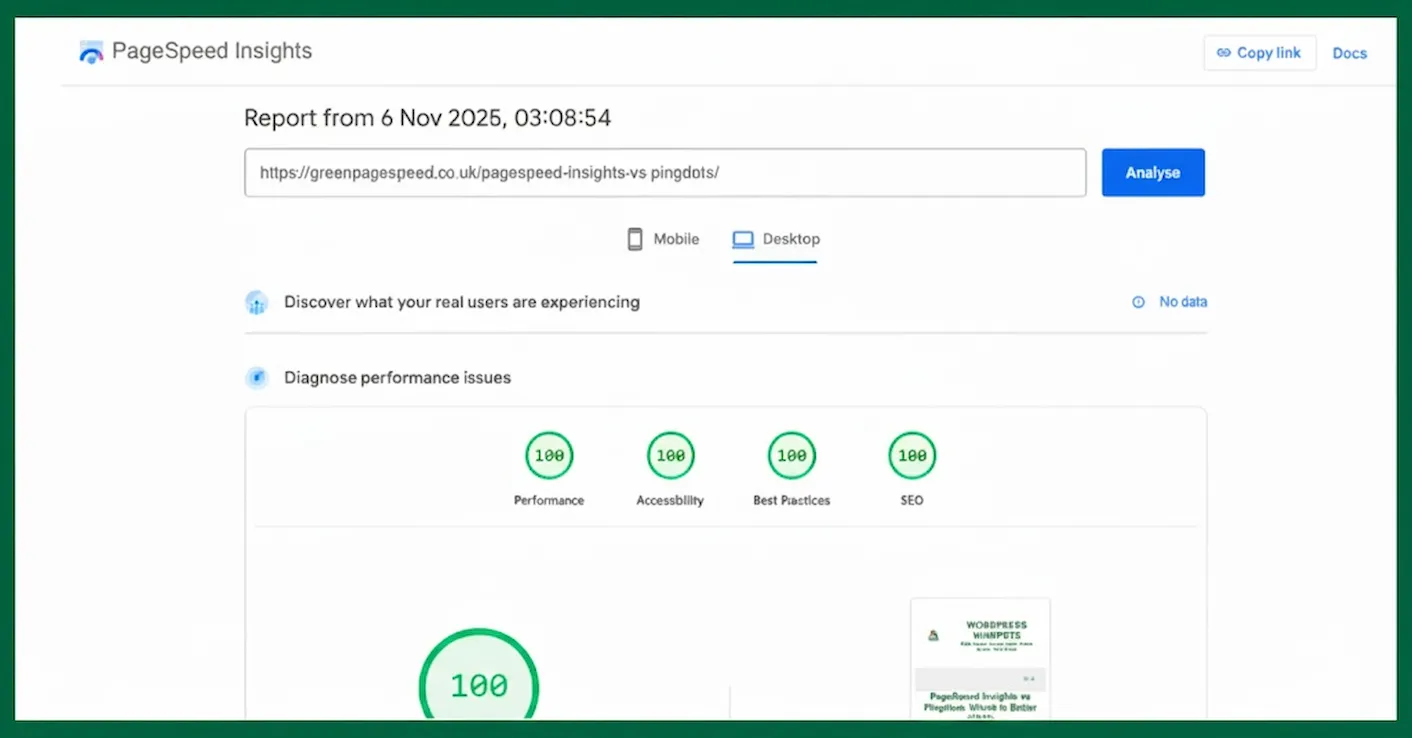
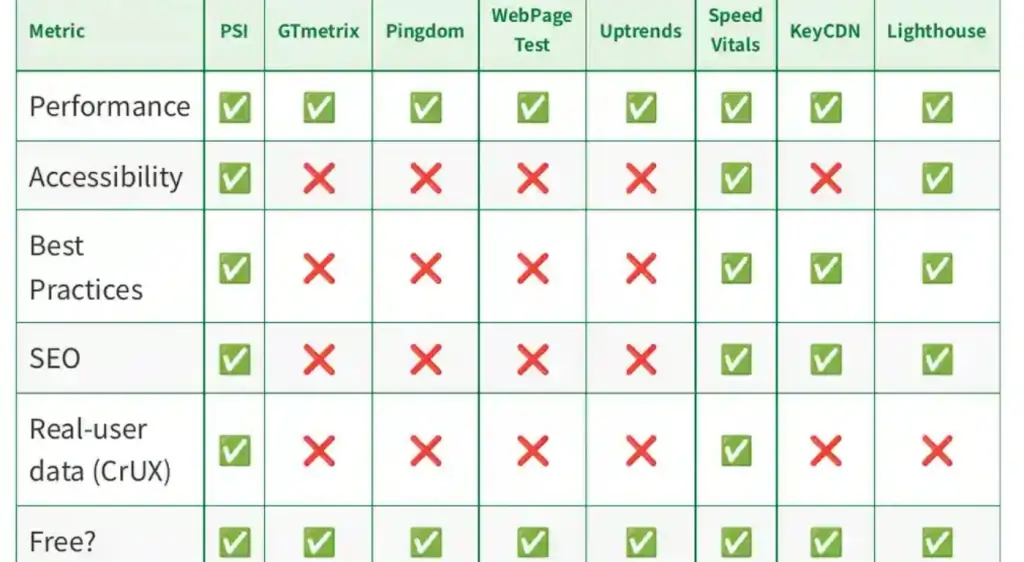
We Compared PageSpeed Tests, So You Don’t Have To
We’ve also compared PageSpeed Insights with other popular speed tools – check them out below:
PageSpeed Insights vs DebugBear
Then
Also
PageSpeed Insights vs WebPageTest
And
PageSpeed Insights vs SpeedVitals
Also
PageSpeed Insights vs Uptrends
As well as
Finally
PageSpeed Insights vs Lighthouse
Why Google Runs Two PageSpeed Insights Tests
Google’s PageSpeed Insights uses Lighthouse to simulate user conditions. To make testing realistic, Lighthouse performs two audits: one mobile, one desktop.
| Environment | Network | CPU | Screen | Impact on Results |
|---|---|---|---|---|
| Mobile | Simulated 4G | 4× CPU slowdown | Small viewport | Lower scores |
| Desktop | Fast broadband | No throttle | Large viewport | Higher scores |
Mobile testing will imitate slower connections and weaker devices.
A desktop assumes strong hardware and fast broadband.
The PageSpeed Insights – Mobile vs Desktop difference exists to show how real users experience your site.
Why Mobile PageSpeed Insights Scores Are Usually Lower
Even well-optimised sites often score lower on mobile. That’s because the simulation is far stricter.
Common reasons include:
-
CPU throttling: Mobile devices are emulated as mid-range phones.
-
Network latency: PSI simulates a 4G delay to mimic real browsing.
-
Render-blocking files: CSS or JS slows down perceived speed.
-
Image weight: Larger files carry higher penalties on small screens.
So, if your desktop result shows 100 but mobile hovers around 90, that doesn’t mean your site is slow – it reflects realistic mobile conditions.
Mobile-First Indexing and SEO Impact
Google uses mobile-first indexing. This means it crawls and ranks based on a mobile version of your website.
This makes your mobile PageSpeed Insights score the primary ranking factor.
Desktop still counts, but mobile drives both visibility and Core Web Vitals performance.
In short, achieving a strong balance between PageSpeed Insights’ mobile and desktop will lead to strong SEO.
Key Metrics in PageSpeed Insights – Mobile vs Desktop Reports
Both versions measure the same metrics:
-
Largest Contentful Paint (LCP) – loading time of main content.
-
Interaction to Next Paint (INP) – how quickly users can interact.
-
Cumulative Layout Shift (CLS) – visual stability as elements load.
Mobile weightings for LCP and INP are heavier because slower devices make delays more noticeable. On desktops, the same issues are less visible thanks to faster CPUs.
Lab Data vs Field Data in PageSpeed Insights
When you click “Analyse,” PSI generates lab data – a synthetic test.
The top panel will display field data, taken from real users (CrUX).
Field data matters most for SEO, even if lab data fluctuates.
Consistent “Good” results in field data prove your site is fast in the real world.
That’s the signal Google trusts most.
How to Improve PageSpeed Insights – Mobile vs Desktop Scores
The optimisation steps that help one version usually help the other.
Focus on fundamentals that improve performance everywhere:
-
Optimise images (WebP or AVIF).
-
Defer or async non-critical JavaScript.
-
Inline essential CSS, defer the rest.
-
Use lightweight themes and clean HTML.
-
Cache and serve content via a CDN.
-
Fix layout shifts (reserve space for banners and embeds).
-
Test regularly to maintain consistency.
Combining fast hosting, such as WPX, with smart plugins.
Plugins such as Asset CleanUp, Flying Scripts, and W3 Total Cache.
They help to keep both mobile and desktop scores in the green zone.
Which PageSpeed Insights Version Matters More for SEO
Google’s ranking systems test the mobile version of your site first.
That means a strong mobile PageSpeed Insights score directly supports Core Web Vitals and organic visibility.
However, desktop still matters for B2B or internal sites with mostly desktop traffic.
The ideal performance range is:
-
Mobile: 90-100
-
Desktop: 100
-
Field data: all metrics “Good.”
That’s a perfectly balanced PageSpeed Insights – Mobile vs Desktop profile.
Closing Thoughts on PageSpeed Insights – Mobile vs Desktop
The difference between PageSpeed Insights’ mobile and desktop results isn’t a problem.
It’s how the tool is designed.
Google expects mobile tests to run lower because they simulate real-world constraints.
Aim for high, stable mobile scores and your desktop results will naturally remain.
Focus on consistency, good field data, and a responsive layout.
That combination gives users a genuinely fast experience and will encourage Google every reason to keep ranking your site higher.